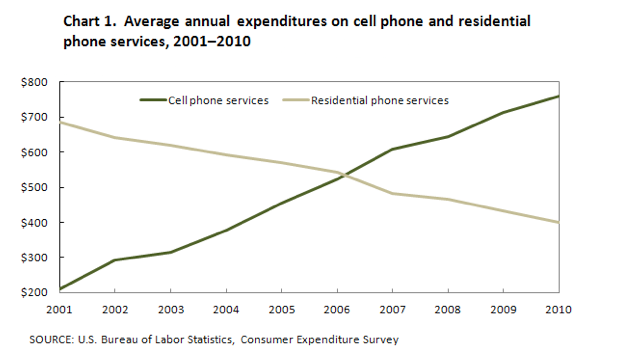
The line graph below shows US consumers’ average annual expenditures on cell phone and residential phone services between 2001 and 2010.

(152 Words, 8 Sentences, 4 Paragraphs, Band 9)
The line graph compares average yearly spending by Americans on mobile and landline phone services from 2001 to 2010.
It is clear that spending on landline phones fell steadily over the 10-year period, while mobile phone expenditure rose quickly. The year 2006 marks the point at which expenditure on mobile services overtook that for residential phone services.
In 2001, US consumers spent an average of nearly $700 on residential phone services, compared to only around $200 on cell phone services. Over the following five years, average yearly spending on landlines dropped by nearly $200. By contrast, expenditure on mobiles rose by approximately $300.
In the year 2006, the average American paid out the same amount of money on both types of phone service, spending just over $500 on each. By 2010, expenditure on mobile phones had reached around $750, while the figure for spending on residential services had fallen to just over half this amount.
(Source: IELTS-Simon (ex-IELTS examiner), NB: Follow the above writing structure for getting higher IELTS band score in the examination. This sample answer can be an example of good writing out of many possible approaches.)
Related IELTS Resources
Take a practice test to find out what is your current weakness in terms of IELTS scale and allow more time to improve your weak spots. The following IELTS resources will help you to develop your skills faster:

Good and interesting write up