
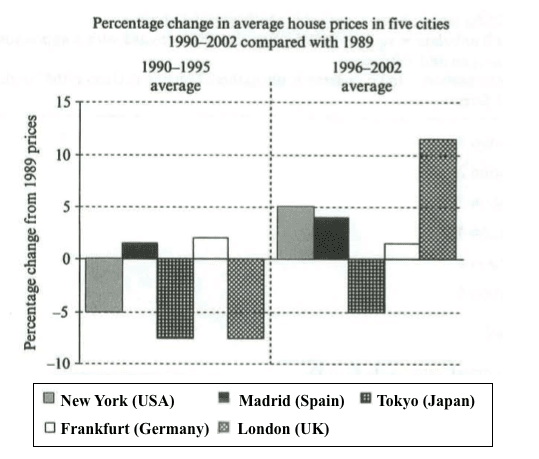
The bar chart below shows information about changes in average house prices in five different cities between 1990 and 2002 compared with the average house prices in 1989.
(161 Words, 8 Sentences, 4 Paragraphs, Band 9)
The bar chart compares the cost of an average house in five major cities over a period of 13 years from 1989.
We can see that house prices fell overall between 1990 and 1995, but most of the cities saw rising prices between 1996 and 2002. London experienced by far the greatest changes in house prices over the 13-year period.
Over the 5 years after 1989, the cost of average homes in Tokyo and London dropped by around 7%, while New York house prices went down by 5%. By contrast, prices rose by approximately 2% in both Madrid and Frankfurt.
Between 1996 and 2002, London house prices jumped to around 12% above the 1989 average. Homebuyers in New York also had to pay significantly more, with prices rising to 5% above the 1989 average, but homes in Tokyo remained cheaper than they were in 1989. The cost of an average home in Madrid rose by a further 2%, while prices in Frankfurt remained stable.
(Source: Cambridge IELTS book 7, and IELTS-Simon (ex-IELTS examiner), NB: Follow the above writing structure for getting higher IELTS band score in the examination. This sample answer can be an example of good writing out of many possible approaches.)
Related IELTS Resources
Take a practice test to find out what is your current weakness in terms of IELTS scale and allow more time to improve your weak spots. The following IELTS resources will help you to develop your skills faster: