
The Line graph and table chart below give information about water use worldwide and water consumption in two different countries.
(176 Words, 9 Sentences, 4 Paragraphs, Band 9)
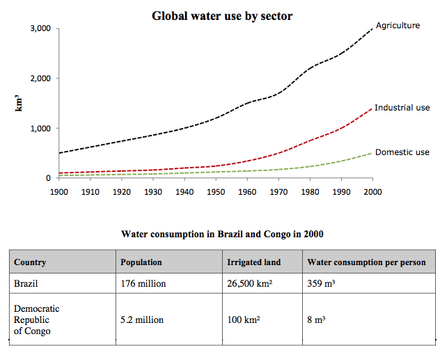
The charts compare the amount of water used for agriculture, industry and homes around the world, and water use in Brazil and the Democratic Republic of Congo.
It is clear that global water needs rose significantly between 1900 and 2000, and that agriculture accounted for the largest proportion of water used. We can also see that water consumption was considerably higher in Brazil than in the Congo.
In 1900, around 500km³ of water was used by the agriculture sector worldwide. The figures for industrial and domestic water consumption stood at around one fifth of that amount. By 2000, global water use for agriculture had increased to around 3000km³, industrial water use had risen to just under half that amount, and domestic consumption had reached approximately 500km³.
In the year 2000, the populations of Brazil and the Congo were 176 million and 5.2 million respectively. Water consumption per person in Brazil, at 359m³, was much higher than that in the Congo, at only 8m³, and this could be explained by the fact that Brazil had 265 times more irrigated land.
(Source: IELTS-Simon (ex-IELTS examiner), NB: Follow the above writing structure for getting higher IELTS band score in the examination. This sample answer can be an example of good writing out of many possible approaches.)
Related IELTS Resources
Take a practice test to find out what is your current weakness in terms of IELTS scale and allow more time to improve your weak spots. The following IELTS resources will help you to develop your skills faster: