
The bar chart below shows the proportions of English men and women of different ages who were living alone in 2011. The pie chart compares the numbers of bedrooms in these one-person households.
(179 Words, 12 Sentences, 4 Paragraphs, Band 9)
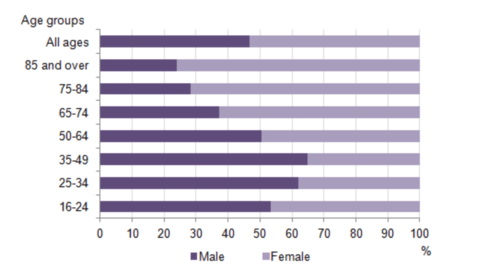
The two charts give information about single-occupant households in England in the year 2011. The bar chart compares figures for occupants’ age and gender, and the pie chart shows data about the number of bedrooms in these homes.
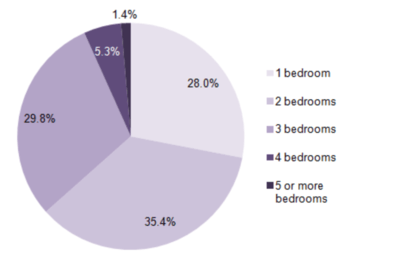
Overall, females made up a higher proportion of people living alone than males, and this difference is particularly noticeable in the older age categories. We can also see that the most common number of bedrooms in a single-occupant home was two.
A significant majority of the people aged 65 or over who were living alone in England in 2011 were female. Women made up around 72% of single occupants aged 75 to 84, and 76% of those aged 85 or over. By contrast, among younger adults the figures for males were higher. For example, in the 35-49 age category, men accounted for nearly 65% of people living alone.
In the same year, 35.4% of one-person households in England had two bedrooms, while one-bedroom and three-bedroom homes accounted for 28% and 29.8% of the total. Under 7% of single-occupant homes had four or more bedrooms.
(Source: IELTS-Simon (ex-IELTS examiner), NB: Follow the above writing structure for getting higher IELTS band score in the examination. This sample answer can be an example of good writing out of many possible approaches.)
Related IELTS Resources
Take a practice test to find out what is your current weakness in terms of IELTS scale and allow more time to improve your weak spots. The following IELTS resources will help you to develop your skills faster:
hey i just cannt understand this grph ,the first one what kind of graph is this?
how the they illustrate proportyion of male and females in the same line
kindly help me in understanding this.