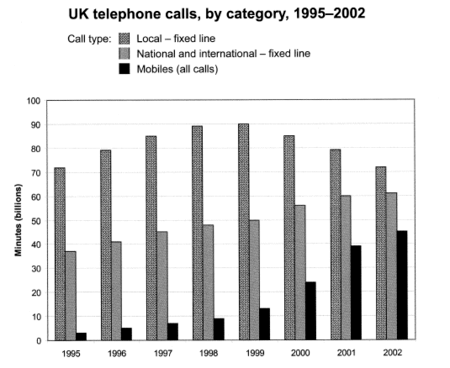
The chart below shows the total number of minutes (in billions) of telephone calls in the UK, divided into three categories, from 1995-2002.

(195 Words, 9 Sentences, 4 Paragraphs, Band 9)
The bar chart compares the amount of time spent by people in the UK on three different types of phone call between 1995 and 2002.
It is clear that calls made via local, fixed lines were the most popular type, in terms of overall usage, throughout the period shown. The lowest figures on the chart are for mobile calls, but this category also saw the most dramatic increase in user minutes.
In 1995, people in the UK used fixed lines for a total of just over 70 billion minutes for local calls, and about half of that amount of time for national or international calls. By contrast, mobile phones were only used for around 4 billion minutes. Over the following four years, the figures for all three types of phone call increased steadily.
By 1999, the amount of time spent on local calls using landlines had reached a peak at 90 billion minutes. Subsequently, the figure for this category fell, but the rise in the other two types of phone call continued. In 2002, the number of minutes of national / international landline calls passed 60 billion, while the figure for mobiles rose to around 45 billion minutes.
(Source: Cambridge IELTS Book 9, NB: Follow the above writing structure for getting higher IELTS band score in the examination. This sample answer can be an example of good writing out of many possible approaches.)
Related IELTS Resources
Take a practice test to find out what is your current weakness in terms of IELTS scale and allow more time to improve your weak spots. The following IELTS resources will help you to develop your skills faster:

I need to to thank you for this great read!! I certainly loved
every bit of it. I’ve got you saved as a favorite to check out new things you post…